Analytics
Answers, not another dashboard
Reporting fails when it produces charts nobody acts on. This is built around the handful of questions that actually change what you do next week.
- No setup or configuration
- Every number drills through
What it answers
The questions worth asking on a Monday
All of these come from transactions you already recorded — there is nothing to instrument first.
Money
- What did we take yesterday, and how does that compare?
- Which days and periods are actually growing?
- What is still outstanding, and who is overdue?
Products
- What is selling, and what has stopped?
- Which stock is sitting still and tying up cash?
- How fast is each product turning over?
Customers
- Who buys repeatedly, and how often?
- What is a customer worth over time?
- Who has quietly stopped coming back?
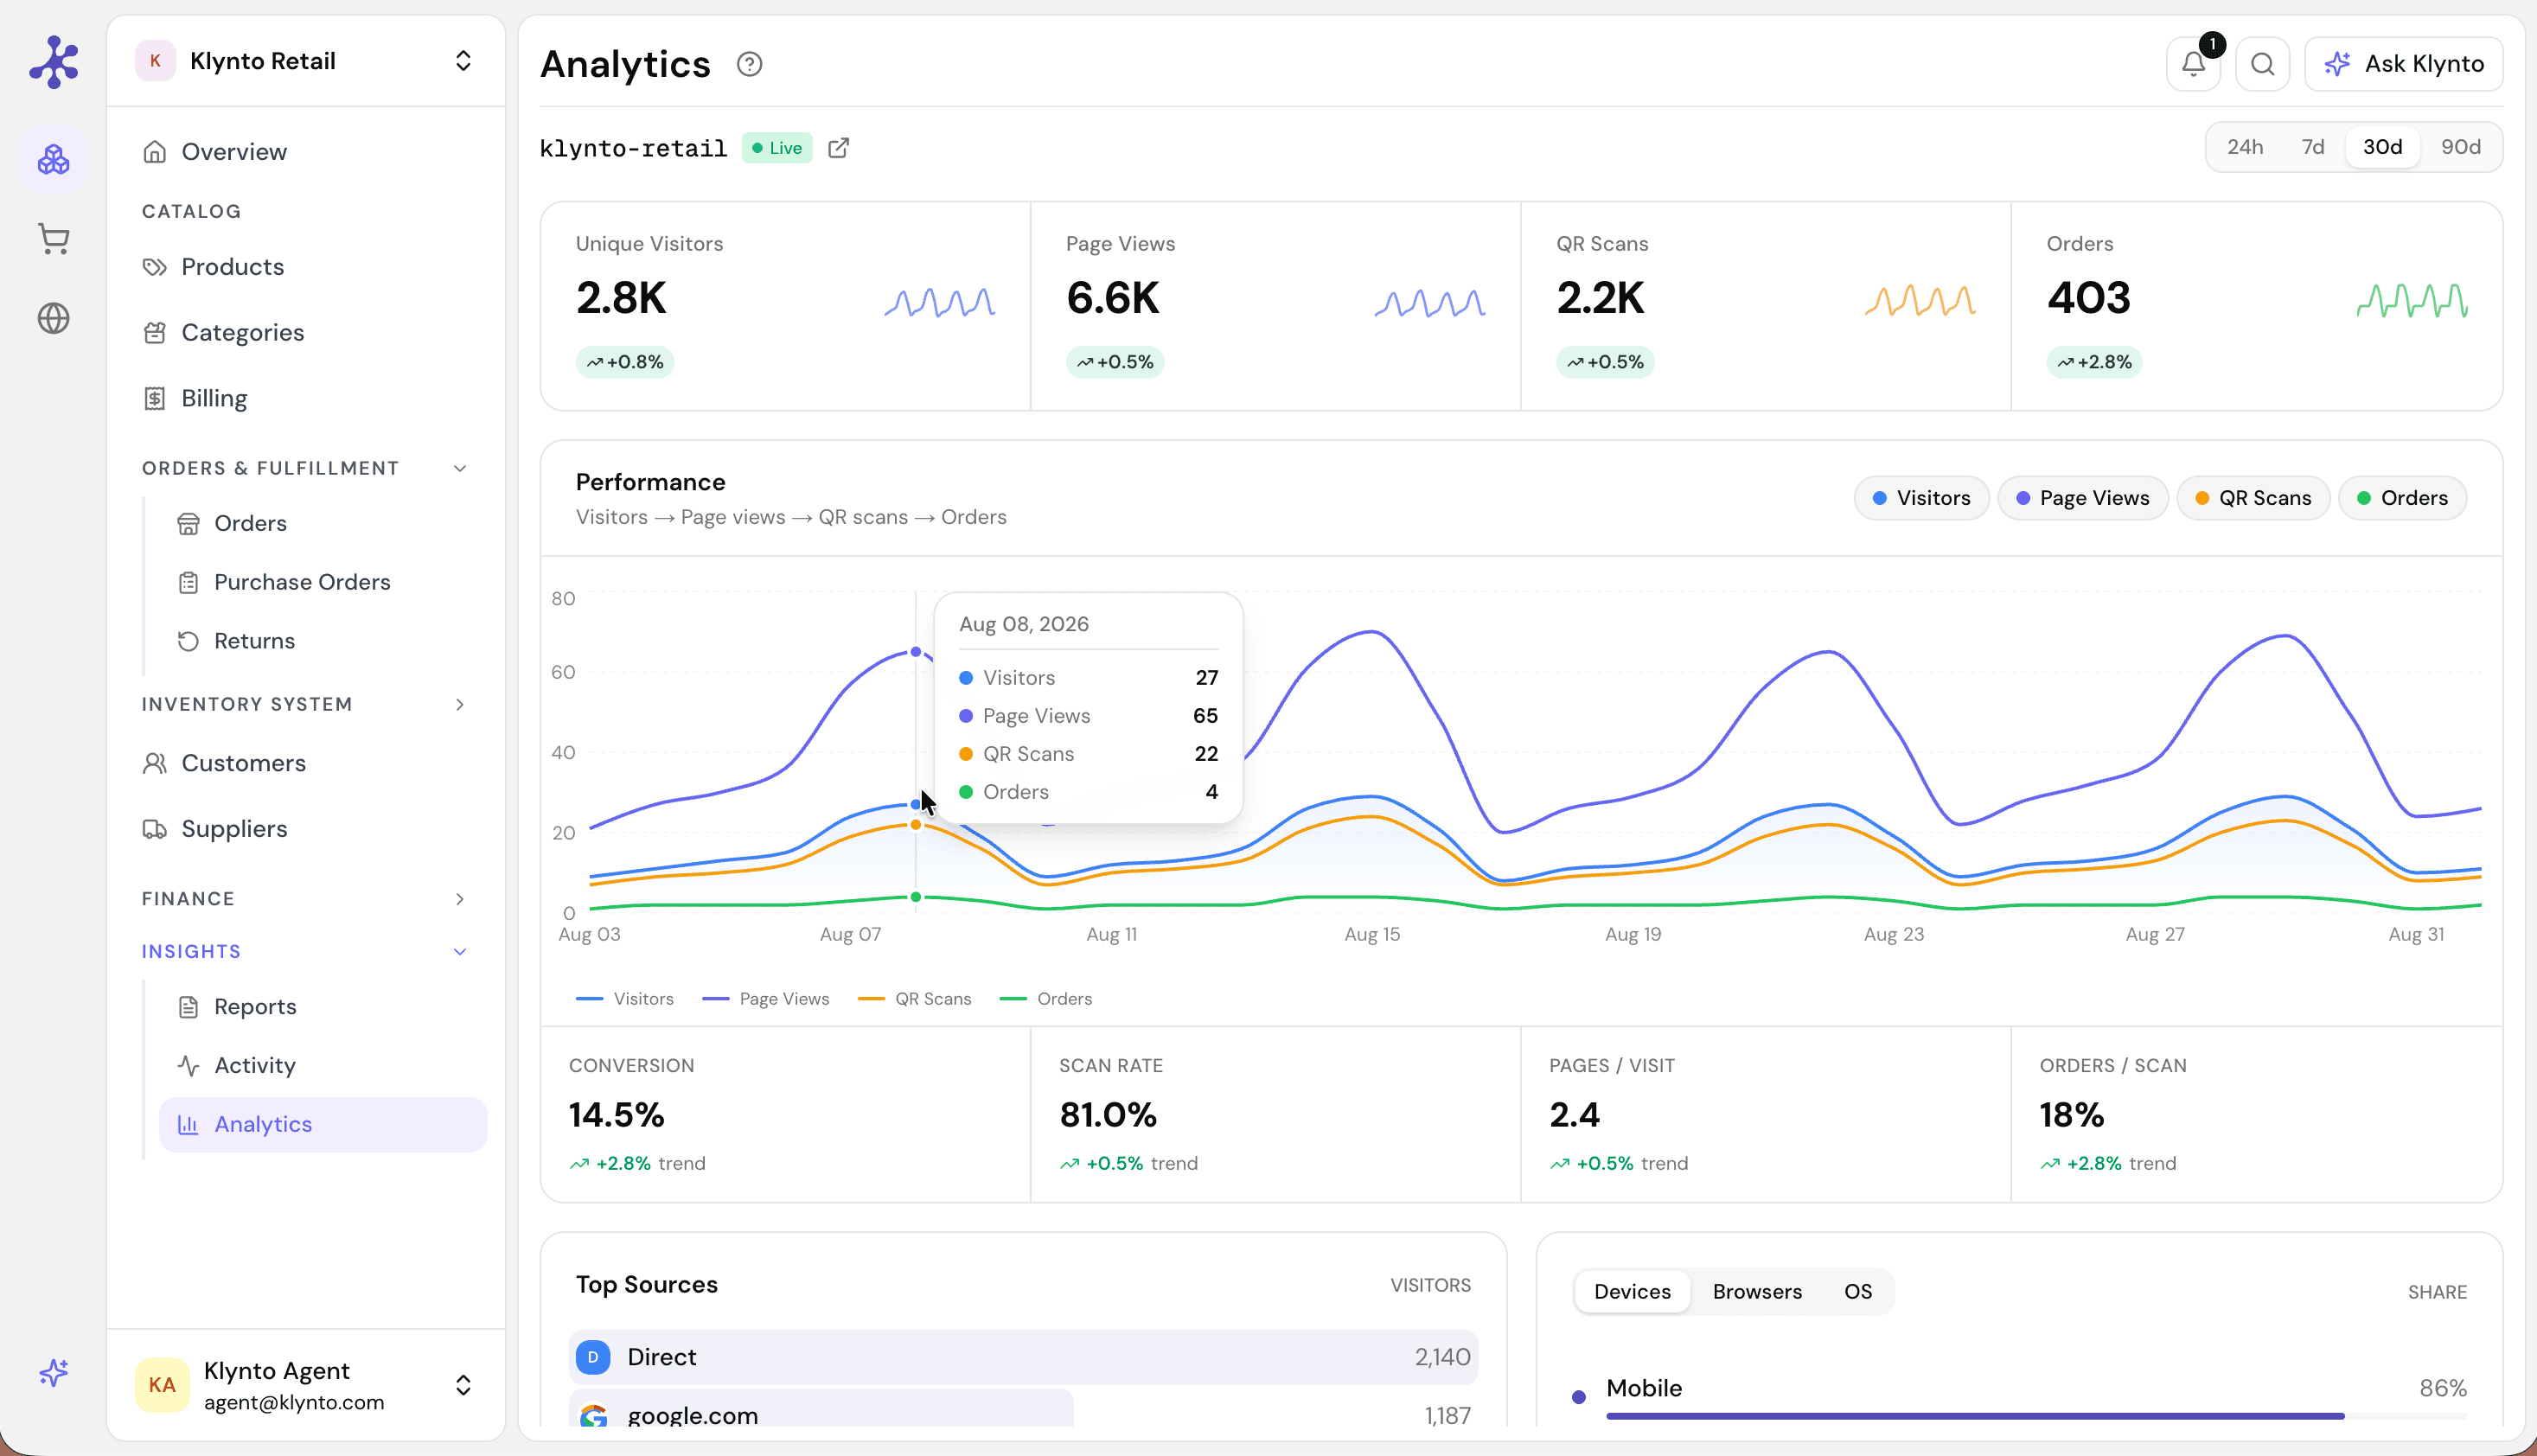
Visitors through to orders on one screen, with every figure drilling back to the records behind it.
How it works
Two things that make a number usable
Nothing to set up first
The reports read the orders, sales, and stock movements the rest of the workspace already produced. There is no tagging step, no configuration, and no separate analytics tool that has to be kept in agreement with reality.
- Metrics load on first login
- Built from records you already have
- No tagging or instrumentation
A figure you can open
A number you cannot interrogate is a number you will not trust. Click any statistic to see the transactions behind it, compare any two periods, and export the result for whoever needs it in a different format.
- Drill from any stat to its records
- Compare any two date ranges
- Export as CSV or PDF
The difference
Where the monthly report goes
Reporting by spreadsheet
On Klynto
The month is assembled by exporting the till and pasting it into a sheet that only one person understands.
The month is already there, built from the same records that produced it.
A surprising figure cannot be checked, so it gets ignored or argued about.
Any figure opens onto the transactions behind it, so it can be verified in a click.
Comparing to last season means finding and reconciling an older file.
Any two periods compare directly, including this year against last.
Included
What the module carries
Sales dashboard
Revenue, orders, and top products in real time.
Trends
What is growing, what is slowing, and when.
Customer insights
Frequency, lifetime value, and churn signals.
Inventory reports
Turnover, dead stock, and reorder performance.
Finance summaries
Daily books, balances, and transaction history.
Date ranges
Compare any period against any other.
Before you rely on it
Reasonable scepticism
Where the numbers come from
Open it after one real day
Run a day of sales through Klynto and see what the dashboard already knows without being told.